
In today’s digital world, the use of data has become a day-to-day business requirement be it in public or private organizations. Whichever industry or field one’s in, you always come across data either indirectly as someone who relies on decisions made from data or directly as the person making sense of it.
Data is a powerful tool and is the fuel behind the most efficient and effective decisions — it might be part of a study helping to cure a disease, helping to catch the spread of COVID19, boost a company’s revenue, make a building more efficient or provide a means for one to evaluate the effectiveness or reach of their advocacy campaign.
At Pollicy, we use data to improve government service delivery and advocate for its use in citizen’s decisions concerning developmental sectors such as education, health, urban development, transportation, and humanitarian relief services.
Surprisingly, for most organizations, lack of data isn’t the challenge they are battling with — it’s the lack of the necessary skills required to extract insights from this data. Data analysis (or data analytics) is the process of extracting insights from the data. It simply refers to the process of working on data with the purpose of arranging it correctly, explaining it, making it presentable, and finding a conclusion from that data. It involves inspecting, cleaning, and transforming data to draw conclusions about the information it contains.
In order to learn from your data;
- The data should be the right data for your questions;
- You need to draw accurate conclusions from that data; and
- You need data that informs your decision-making process
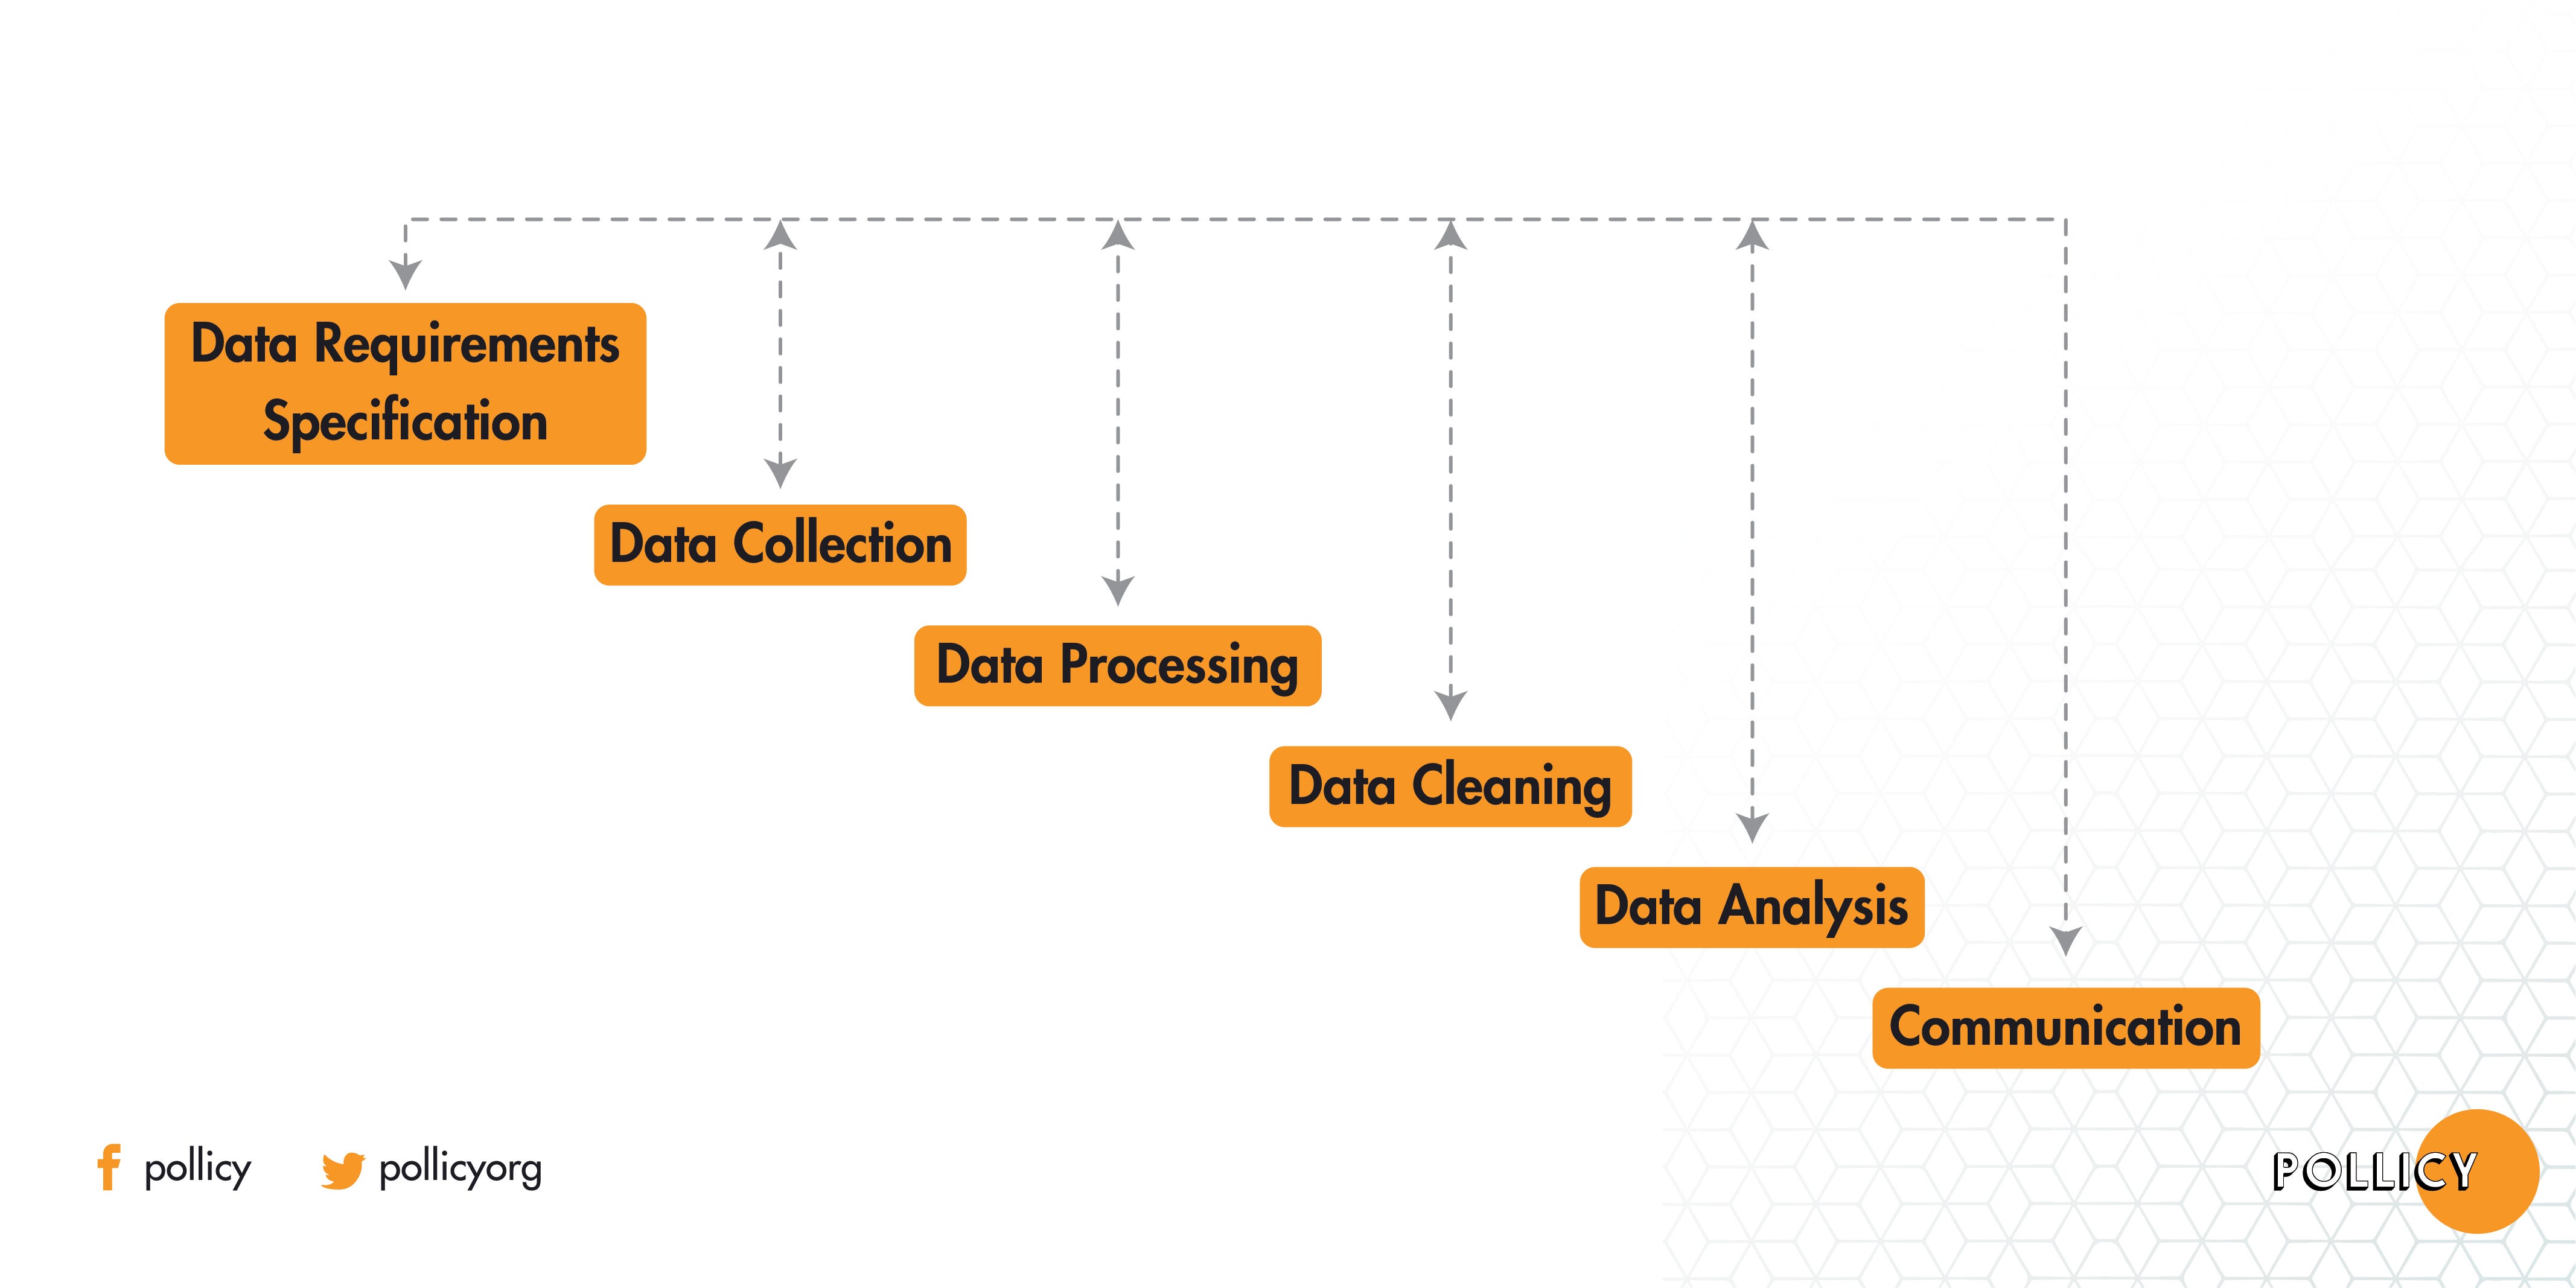
Data analysis consists of several phases and the initial phase being data collection followed by data processing, data cleaning then data analysis, and communication.

Before kicking off your data analysis project, you should be aware of the vast amount of tools at your disposal. A wide range of these tools exists each providing a range of features for specific data tasks. These include; R, SPSS, Python, MS Excel, and STATA, etc. You can choose either of the tools depending on the amount of you have, the intended tasks, the features, the compatibility or flexibility of the tool, the funds you have available, etc. Tools like SPSS and STATA require a specialized license for use while Excel can be accessed through Microsoft or access to the online version of the product commonly referred to as Google sheets. R and Python are open source software that can be accessed freely. Our tutorial focused on introducing participants to STATA and here is a recap of how you can get started with the tool;
Introduction to STATA
Stata is a powerful statistical software that enables users to analyze, manage, and produce graphical visualizations of data. It is primarily used by researchers in the fields of economics, biomedicine, and political science to examine data patterns. It has both a command-line and graphical user interface making the use of the software more intuitive.
Basics you need to know about STATA;
Reading in Stata Format (.dta) Data Files: Stata data files have .dta extensions
Importing an Excel or Text Data File into Stata: To import an Excel file (e.g. “Example_Dataset.xlsx”) click on File, then on Import, then on Excel spreadsheet. A new window will open. Click Browse and navigate to the folder where the data file you want to use is stored, and then click on Open. You will see a preview of the data file in the “Import Excel” window. If the first row of your data file contains the variable names, as it does for the “Example_Dataset” data file, check the box next to “Import first row as variable names”:
Saving a Dataset in Stata Format: If you make modifications to an original dataset (say by recoding variables, or creating new ones), it is best practice to save the modified dataset as a new data file, instead of overwriting the original file. That way if there turn out to be errors in the modified file, you can always start afresh with the original dataset.
Recoding and Labeling Variables: Recoding categorical or quantitative variables can be useful in a number of circumstances. For example, you might want to use fewer, more aggregated categories than those used in collecting the data, change the ordering of a variable’s categories for some reason, or recode a quantitative variable as a categorical variable.
Creating a “Do” File in Stata: A do file lists and executes Stata commands. It is a convenient and efficient alternative to typing commands in the Stata command box. By storing commands for a particular analysis in a do file, you can easily replicate your results, re-run your analysis with modifications and elaborations, or repeat it after correcting errors. A do file is a separate file that has a “.do” extension
Learn more about STATA from here. Follow our social media accounts on Facebook and Twitter to keep up with our events. This should provide you with timely information about our events and webinars.
Written by Sandra Nabulega (Junior Researcher) and edited by Arthur Kakande (Data Products Lead) at Pollicy.


Leave A Comment